Trust in the vote: The Tennessee Poll by ETSU highlights widespread confidence in national, state election
With the 2024 Presidential election just days away, election integrity remains a top concern for many Tennesseans.
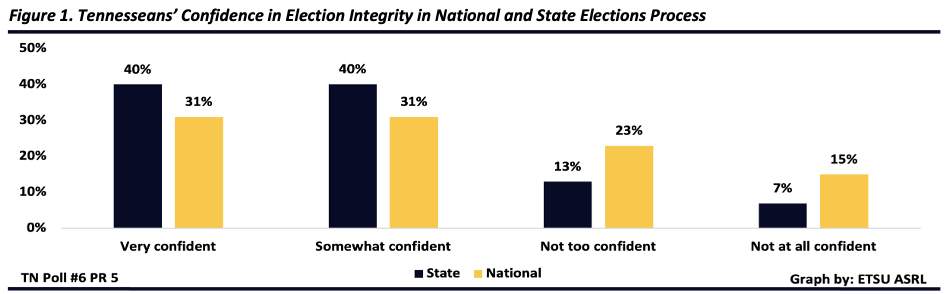
In the latest Tennessee Poll, conducted in late July 2024, the Applied Social Research Laboratory (ASRL) at East Tennessee State University explored Tennesseans’ confidence in election integrity both nationally and at the state level. The results reveal that while a majority of Tennesseans (62%) feel either very confident (31%) or somewhat confident (31%) in the accuracy of national election vote casting and counting, confidence is even stronger for state elections. Specifically, 80% of Tennesseans believe that votes in Tennessee will be accurately cast and counted, underscoring high public trust in how the state is handling election integrity. See figure 1.
Confidence in elections across the nation
Discussion around election security and the accuracy of vote casting and counting has been central to political dialogue since the contested 2020 results. Although court cases since 2020 have not yielded evidence of widespread voter fraud, this issue remains a focal point in current election discussions. As such, ASRL staff thought it important to see where Tennesseans stand on the matter of election integrity.
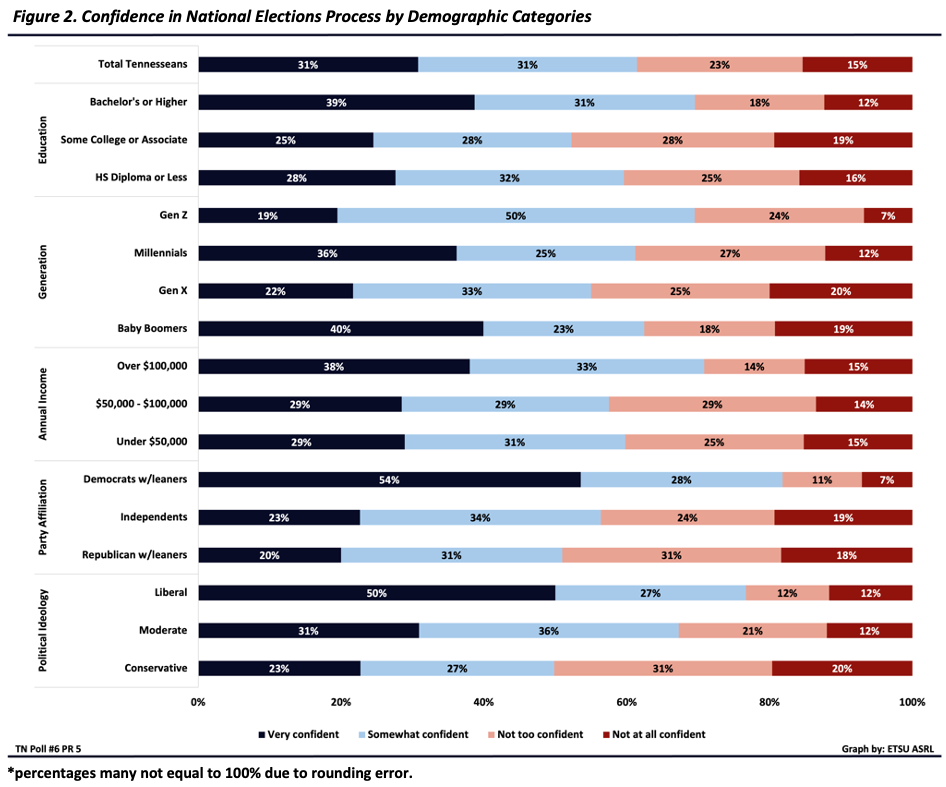
Tennesseans registered to vote, as well as those who reported voting in the 2020 election, show significantly higher confidence in the accuracy of presidential election vote casting and counting compared to non-registered voters or those who did not vote in 2020. Findings from the Tennessee Poll indicate that education, income, age, party identification and political ideology are all significant factors influencing a person’s confidence in national vote accuracy1. Tennesseans with higher education levels report greater confidence: 70% of those with a bachelor’s degree or higher are very or somewhat confident in national elections, compared to 60% of those with a high school diploma or less education and 52% of those with some college education.
Generational cohort also plays a role. Baby boomers and Gen X are more likely to report being "not at all confident" in national vote accuracy compared to millennials and Gen Z, a pattern likely influenced by higher Republican affiliation among older generations. When examined by party, Republicans and Republican-leaning individuals are generally less confident in vote accuracy than Independents or Democrats. Still, a majority of Republicans (51%), Independents (56%), and Democrats (82%) report being very or somewhat confident that votes will be cast and counted accurately. Despite ongoing discussions questioning national election integrity, these findings suggest that most Tennesseans maintain confidence that national votes will be accurately cast and counted, reinforcing trust in the electoral process. See figure 2.
Confidence in Tennessee elections
A majority of Tennesseans report confidence in the election process nationwide, but this confidence is even more pronounced regarding the state’s own election process. When asked about Tennessee specifically, 80% of Tennesseans say they are either very confident (40%) or somewhat confident (40%) that votes will be accurately cast and counted in this year’s presidential election. Only a small portion of respondents report being not too confident (13%) or not at all confident (7%), underscoring strong trust in Tennessee’s statewide election system. See figure 1.
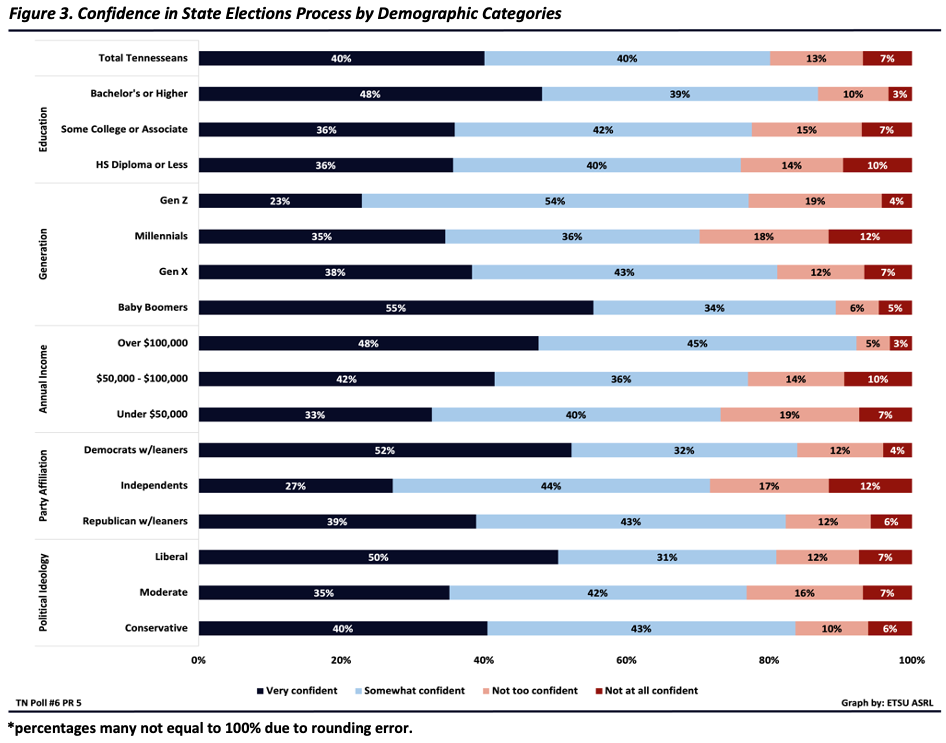
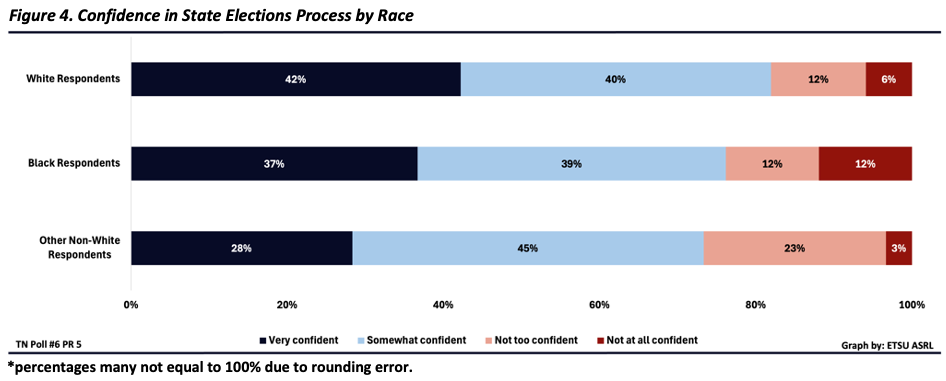
Similar to patterns seen with national election confidence, significant differences emerge based on voting status, participation in the 2020 election, political ideology, party affiliation, income, education and generation. However, unlike national election confidence, there are notable differences by race when examining statewide election integrity. When asked about confidence in Tennessee’s vote accuracy, 42% of White Tennesseans reported being very confident, compared to 37% of Black Tennesseans and 28% of other non-White Tennesseans. See figures 3 and 4.
In summary, Tennesseans exhibit high levels of trust in the accuracy of vote casting and counting both nationally and within their own state. While certain factors — such as voting status, political affiliation, education, income, age and race — introduce slight variations in confidence levels, the majority across all groups remain either very or somewhat confident in the integrity of the election process. These findings reflect a strong baseline of public trust in both national and state election systems going into the 2024 Presidential election.
Footnote:
1 statistically significant. p<.05"
This is the fifth in a series of data releases from The Tennessee Poll. We provide methodological information, margin of error estimates, as well as detailed tables with analysis on each question by different demographic categories. To find these, or to be added to our distribution list, go to etsu.edu/tnpoll. Graphics are provided for press use.
Important Notes:
This press release was originally due to be released on Oct. 25. Due to the devastating impact of Hurricane Helene on our community, we delayed the release series. We at the Applied Social Research Lab ask that you keep our impacted Tennessee, North Carolina and Virginia communities in your thoughts. The toll on our communities has been profound, and your support can make a difference. To learn how you can help, visit the ETSU Response page, “Bucs Rebuild Together.”
About the Tennessee Poll
The Tennessee Poll is conducted by the Applied Social Research Lab (ASRL) in the Department of Sociology and Anthropology at East Tennessee State University. ASRL is directed by Dr. Kelly N. Foster, professor of sociology.
The Tennessee Poll is an annual public opinion poll funded by ETSU. The mission of The Tennessee Poll is to provide the citizens and governance of Tennessee with neutral, unbiased information on Tennesseans’ perceptions of issues that impact their health, education, and quality of life.
Though the project has been internally funded to date, there exists the possibility of outside researchers or organizations being given the option to purchase space for questions on future polls. Should this occur, any and all funding sources will be noted in the methodology report for that particular poll.
About the Authors
This press release was prepared by Drs. Kelly N. Foster, Candace Bright Hall-Wurst and Trena Paulus. Graphics prepared by Morgan Jones Kidd and M. Rebecca Strasser. For information and biographies on the contributors to this release, see etsu.edu/asrl.
East Tennessee State University was founded in 1911 with a singular mission: to improve the quality of life for people in the region and beyond. Through its world-class health sciences programs and interprofessional approach to health care education, ETSU is a highly respected leader in rural health research and practices. The university also boasts nationally ranked programs in the arts, technology, computing, and media studies. ETSU serves approximately 14,000 students each year and is ranked among the top 10 percent of colleges in the nation for students graduating with the least amount of debt.
Stay in Touch
Follow ETSU on Social