Tennesseans with children struggle with food insecurity
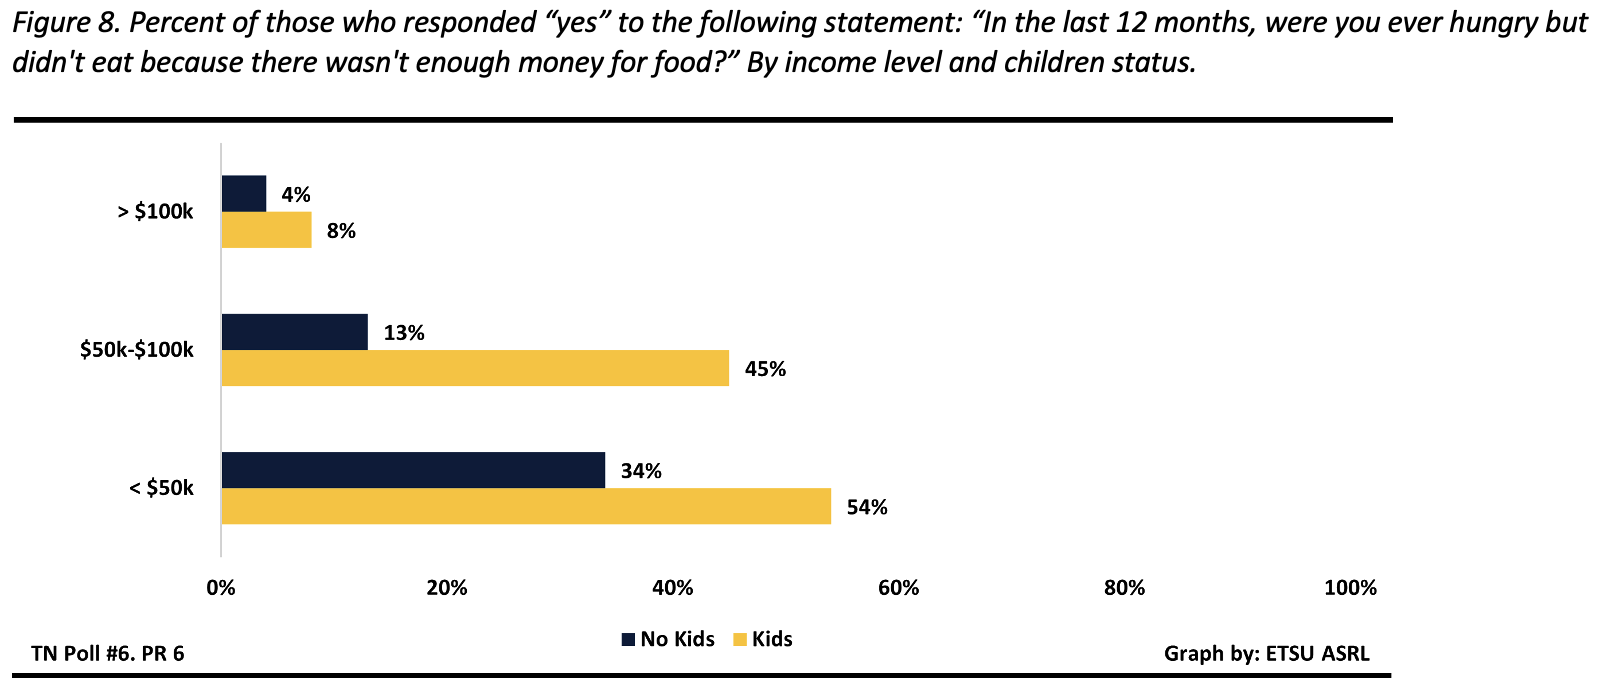
Approximately 1 in 4 Tennesseans (24%) report going hungry in the last 12 months due to lack of money for food, and respondents with children are twice as likely to report this than respondents without children (39% and 17%, respectively), according to The Tennessee Poll conducted by the Applied Social Research Laboratory (ASRL) at East Tennessee State University.
Food insecurity is defined as: “a household-level economic and social condition of limited or uncertain access to adequate food”.1,2 Limited access to food has been found to increase the likelihood of chronic and mental health conditions and impact school performance in children.3
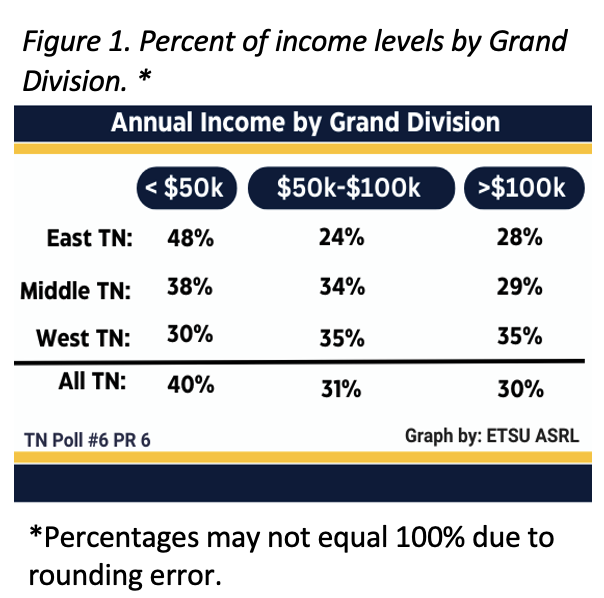
The Tennessee Poll asked Tennesseans a series of questions regarding the impact of finances on food insecurity in the past 12 months. Findings were compared across gender, party affiliation, race, age, generation, education, annual income, and whether respondents reside in East, Middle or West Tennessee (i.e., Tennessee Grand Divisions). An important factor in this release is the significant relationship between income level and region of residence in Tennessee. According to the ASRL’s sample, nearly half of East Tennesseans (48%) report a household income of less than $50, 000 compared to 38% of Middle Tennesseans and 30% of West Tennesseans. See figure 1.
Not enough money to buy more food
Most Tennesseans (52%) report that in the previous 12 months, they never had an issue buying more food if theirs ran out. However, almost half of all Tennesseans (48%) indicated they could not afford additional food either “sometimes” (29%) or “often” (19%). Tennesseans most likely to struggle with food lasting and lacking funds to buy more included Gen Z (sometimes true – 47%; often true – 30%), millennials (sometimes true – 42%; often true – 31%), those with annual incomes under $50,000 (sometimes true – 38%; often true – 31%), and those with a high school diploma or less (sometimes true – 34%; often true – 28%).
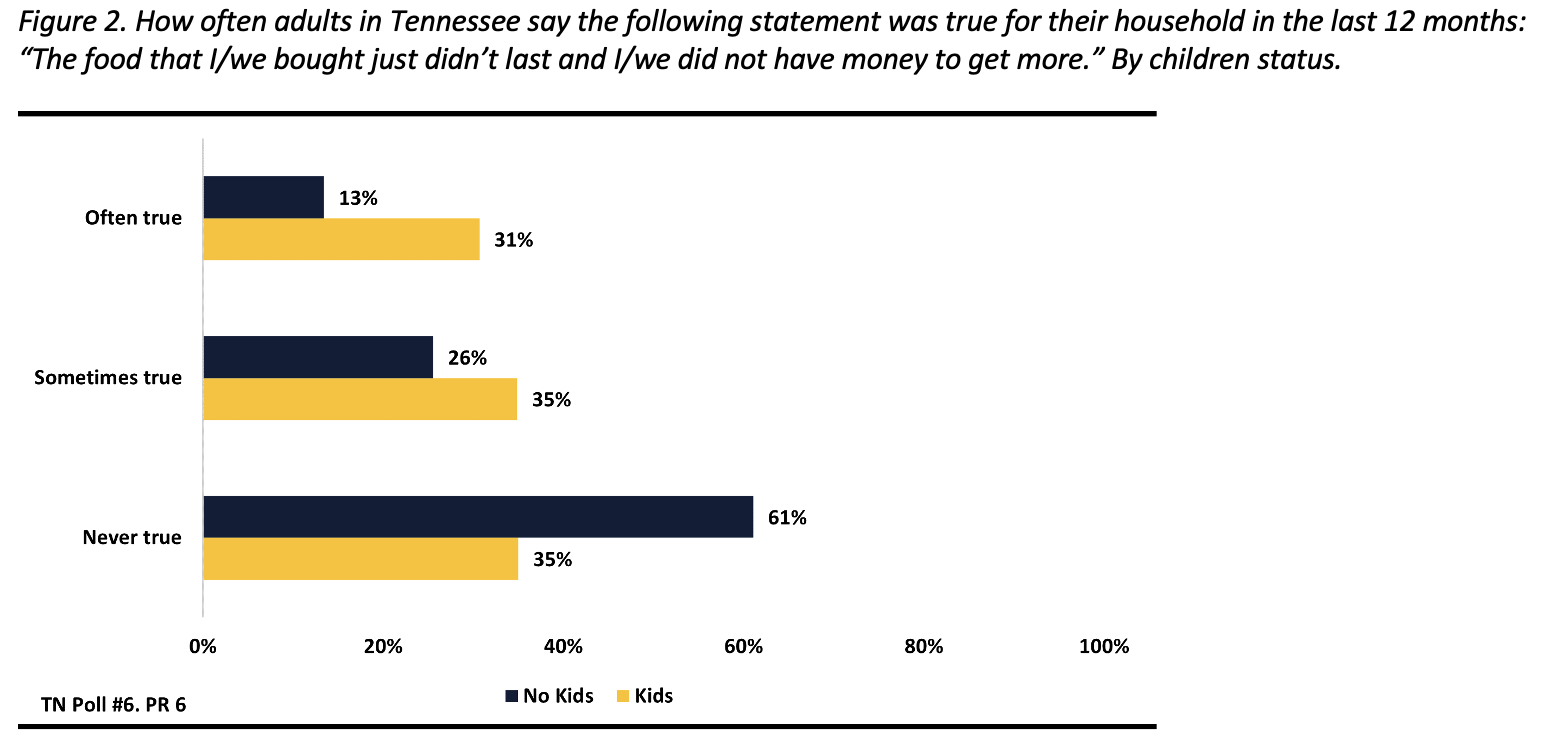
Further analysis reveals that one of the distinguishing characteristics around food insecurity among Tennesseans is if they have children in the house under the age of 18. Tennesseans with children report more often that the food they purchased did not last in the last 12 months. When asked specifically about food lasting, 31% of those with children reported that it was often true that the food they bought did not last long enough compared to 13% of those without children. Only 35% of those with children reported “never true” to this statement compared to a majority of those without children (61%). See figure 2.
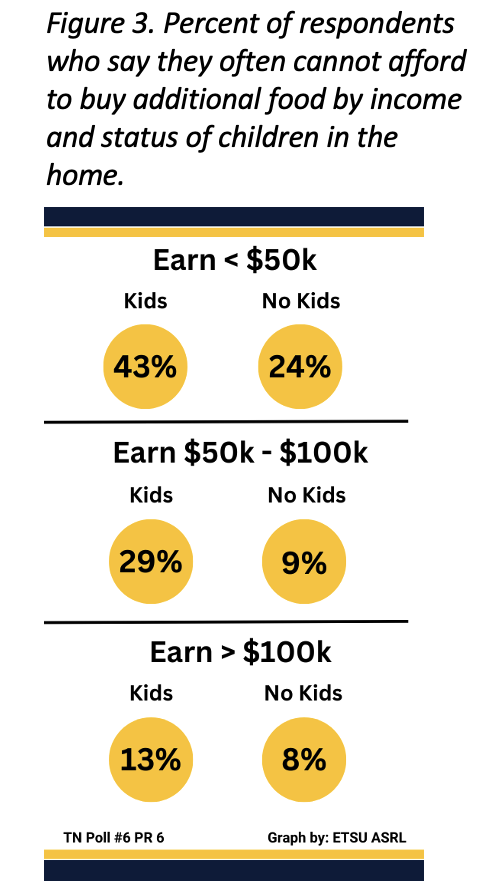
Regardless of income, adults with children were more likely than those without children to struggle with affording more food, even among households earning over $100,000. Among those earning less than $50,000, 43% of those with children reported often struggling to afford more food, compared to 24% of those without children. Among those earning between $50,000 and $100,000, 29% of those with children reported often struggling to afford more food, compared to only 9% of those without children. Similarly, for those earning more than $100,000, 13% of those with children reported often struggling to afford more food, compared to only 8% of those without children. See figure 3.
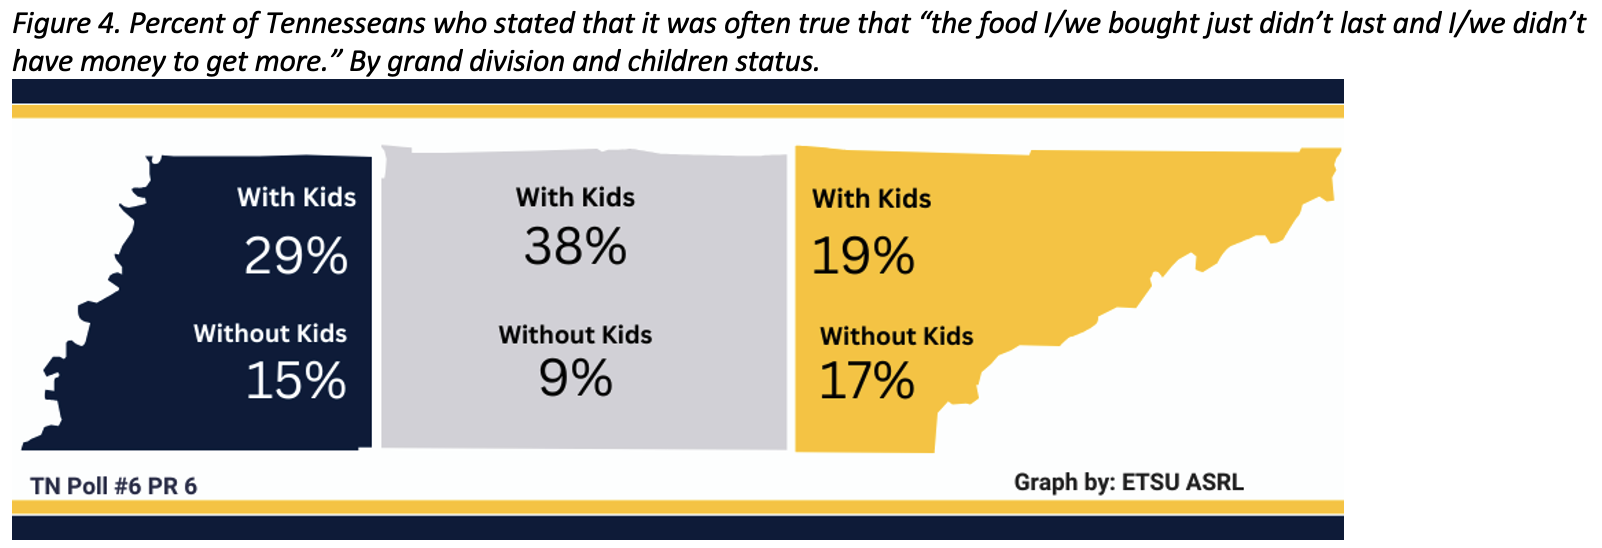
In Middle Tennessee, respondents with children (38%) were over three times as likely to report often being unable to afford more food than those without children (9%). This difference is notably larger than those observed in East and West Tennessee. See figure 4.
Not enough money to afford balanced meals
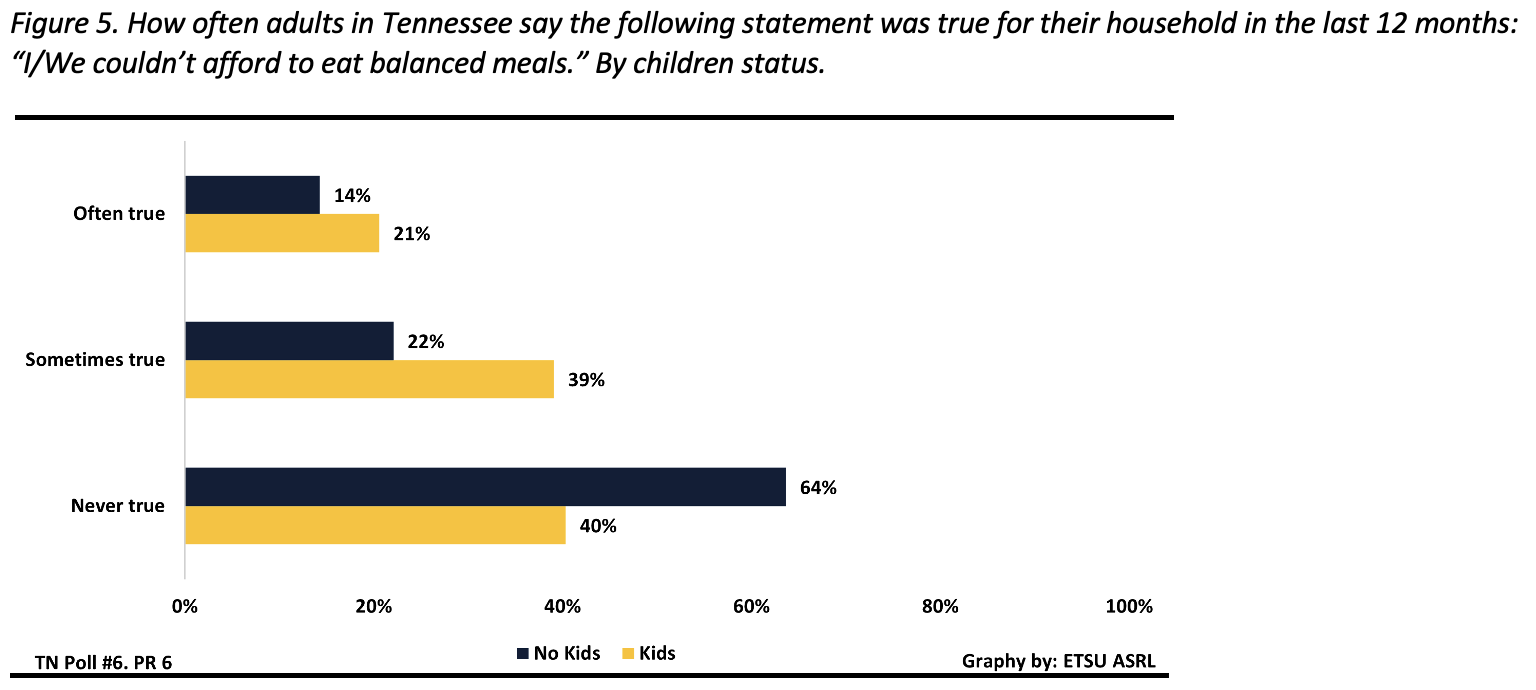
Overall, 56% of respondents reported that not having enough money to afford balanced meals was “never true” for them. However, for other respondents, this was “sometimes true” (28%) or “often true” (16%). The demographic patterns among those who often struggled to eat balanced meals mirrored those of individuals who were unable to afford more food. A majority of Tennesseans with children either sometimes or often (60%) struggled to afford balanced meals, compared to 36% of those without children. See figure 5.
Respondents earning less than $50,000 reported the most difficulty affording balanced meals—80% of those with children indicated this was “sometimes true” or “often true,” compared to 62% of those without children. Another group facing difficulty affording balanced meals was those earning between $50,000-$100,000 with children (59%) compared to those without children (28%). Even those earning over $100,000 with children (28%) struggled more with affording balanced meals than those without children (17%).
Finances impact the amount of food adults with children eat
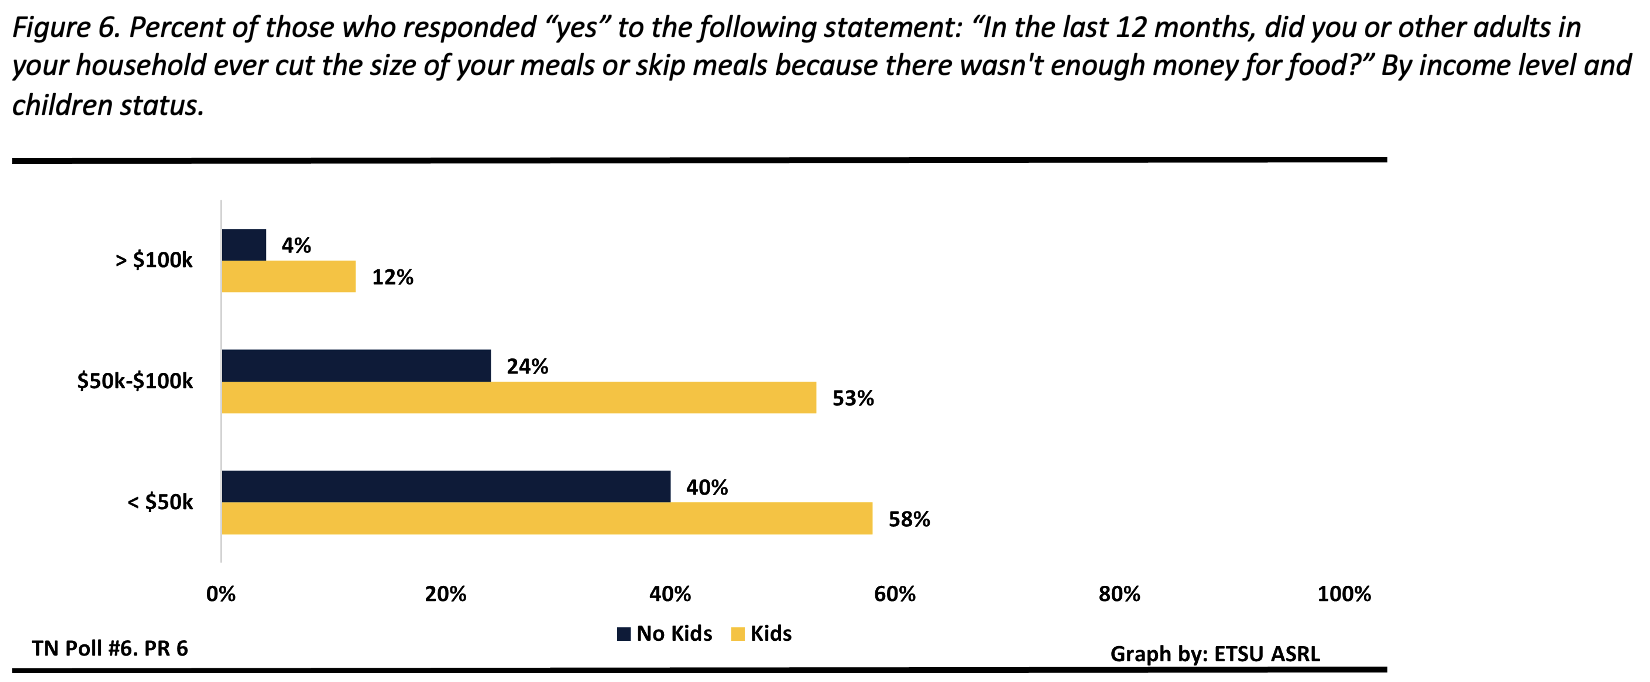
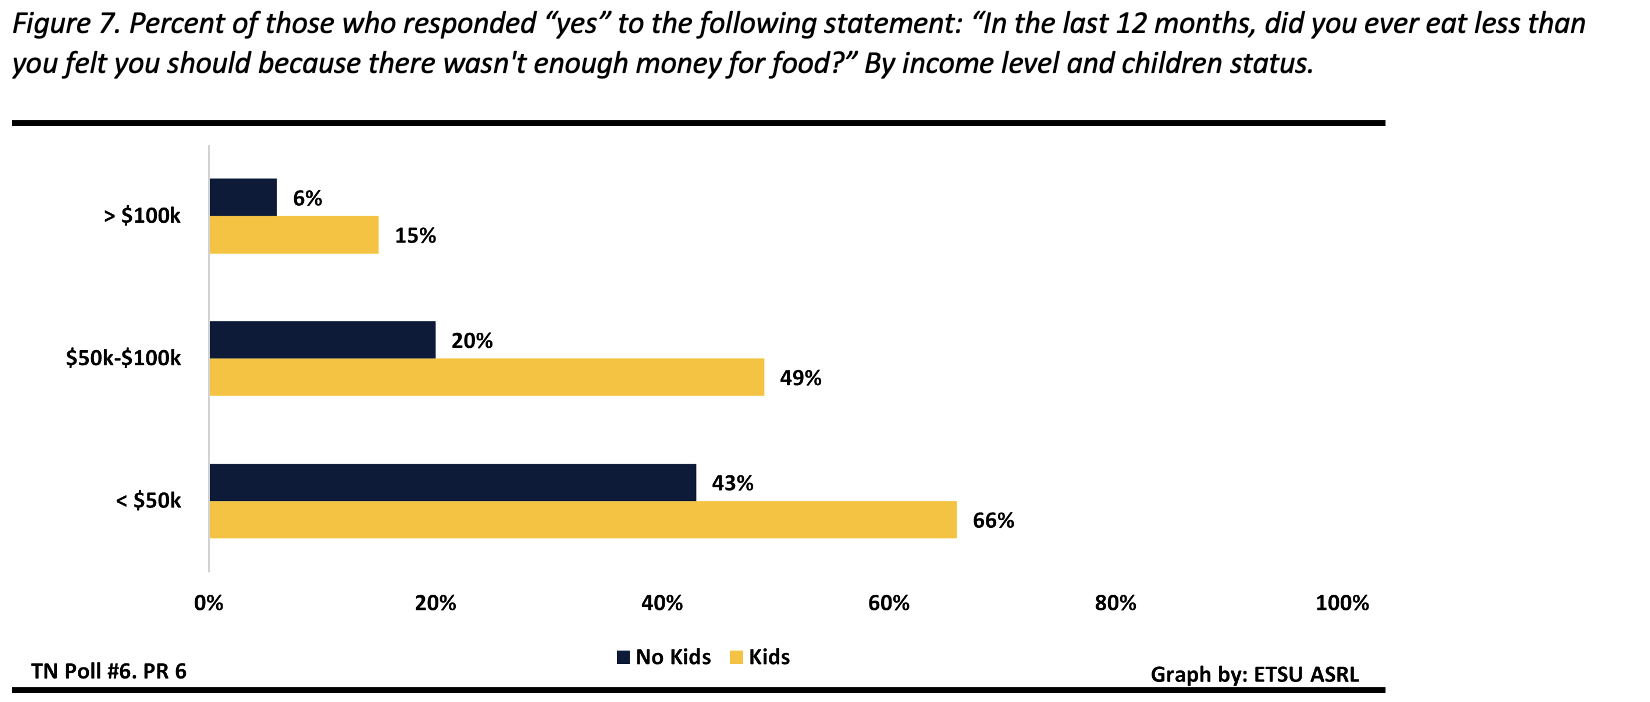
Guardians of children tend to prioritize feeding their children over themselves. Tennesseans who have children reported cutting the size of their meals (44%), eating less than they felt they should (47%), and being hungry but not eating (39%) because there was not enough money for food. In comparison, those without children reported these instances significantly less (cut size of their meals – 23%; ate less – 23%; went hungry – 17%).
For respondents earning between $50,000-$100,000 annually, the differences between having children and not having children were significant in terms of cutting the size of meals, eating less than needed, and being hungry. Those with children were twice as likely to cut meal sizes or skip meals (53%) and eat less than they felt they should (49%) because there was not enough money for food in comparison to those without children (cutting meal size or skipping meals – 24%; eating less – 20%). Middle income earners with children were also three times as likely to be hungry and not eat (46%) because of the financial situation in comparison to those in the same income level (13%) without children. See figures 6-8.
References:
This is the sixth in a series of data releases from The Tennessee Poll. We provide methodological information, margin of error estimates, as well as detailed tables with analysis on each question by different demographic categories. To find these, or to be added to our distribution list, go to etsu.edu/tnpoll. Graphics are provided for press use.
Important Notes:
This press release was originally due to be released on Nov. 1. Due to the devastating impact of Hurricane Helene on our community, we delayed the release series. We at the Applied Social Research Lab ask that you keep our impacted Tennessee, North Carolina and Virginia communities in your thoughts. The toll on our communities has been profound, and your support can make a difference. To learn how you can help, visit the ETSU Response page, “Bucs Rebuild Together.”
About the Tennessee Poll
The Tennessee Poll is conducted by the Applied Social Research Lab (ASRL) in the Department of Sociology and Anthropology at East Tennessee State University. ASRL is directed by Dr. Kelly N. Foster, professor of sociology.
The Tennessee Poll is an annual public opinion poll funded by ETSU. The mission of The Tennessee Poll is to provide the citizens and governance of Tennessee with neutral, unbiased information on Tennesseans’ perceptions of issues that impact their health, education, and quality of life.
Though the project has been internally funded to date, there exists the possibility of outside researchers or organizations being given the option to purchase space for questions on future polls. Should this occur, any and all funding sources will be noted in the methodology report for that particular poll.
The Applied Social Research Lab is a member of the Association of Academic Survey Research Organizations (AASRO) and adheres to the reporting requirements of the American Association for Public Opinion Research Transparency Initiative standards in research reporting.
For detailed information on The Tennessee Poll, including methodology and additional analysis, visit etsu.edu/tnpoll.
About the Authors
This press release was prepared by M. Rebecca Strasser and Drs. Candace Bright Hall-Wurst and Kelly N. Foster. Graphics prepared by Ms. Morgan Jones Kidd. For information and biographies on the contributors to this release, see etsu.edu/asrl.
East Tennessee State University was founded in 1911 with a singular mission: to improve the quality of life for people in the region and beyond. Through its world-class health sciences programs and interprofessional approach to health care education, ETSU is a highly respected leader in rural health research and practices. The university also boasts nationally ranked programs in the arts, technology, computing, and media studies. ETSU serves approximately 14,000 students each year and is ranked among the top 10 percent of colleges in the nation for students graduating with the least amount of debt.
Stay in Touch
Follow ETSU on Social