 Dr. Mark Kleinman is the corresponding author of a new publication in Aging,“Deciphering
age-related transcriptomic changes in the mouse retinal pigment epithelium.” Dr. Kleinman
continues advancing the scientific investigation of immune-mediated inflammation in
age-related eye disorders with the current publication. The study not only serves
to elucidate the gene expression changes occurring during the natural aging process
of the retinal pigment epithelium (RPE) by comparing transcriptome profiles between
young and aged mice, it also details a novel method of investigating cellular and
molecular mechanisms of RPE aging and in screening of therapeutic compounds.
Dr. Mark Kleinman is the corresponding author of a new publication in Aging,“Deciphering
age-related transcriptomic changes in the mouse retinal pigment epithelium.” Dr. Kleinman
continues advancing the scientific investigation of immune-mediated inflammation in
age-related eye disorders with the current publication. The study not only serves
to elucidate the gene expression changes occurring during the natural aging process
of the retinal pigment epithelium (RPE) by comparing transcriptome profiles between
young and aged mice, it also details a novel method of investigating cellular and
molecular mechanisms of RPE aging and in screening of therapeutic compounds.
In vitro cultures have been utilized as aging research models for various cell types, yet their application to RPE models remains largely unexplored.One of the study objectives was to assess long-term primary human (hRPE) cultures as a model for studying aging by comparing cellular characteristics and transcriptomic profiles. Using this model, the scientists observed a marked upregulation of immunogenic, proinflammatory, and oxidative stress genes in aging RPE. Additionally, aging RPE exhibited dysregulation of pathways associated with visual perception and extracellular matrix production.Dr. Kleinman says, “Our findings underscore the pivotal role of inflammation, immune activation, and oxidative stress in the aging RPE landscape and provide insights into why age increases the risk of retinal pathologies, laying the groundwork for therapeutic interventions aimed at delaying aging processes and targeting blinding retinal diseases such as age-related macular degeneration.”
Dr. Mark Kleinman is a professor in the Department of Surgery and is a member of the Center of Excellence in Inflammation, Infectious Disease, and Immunity.
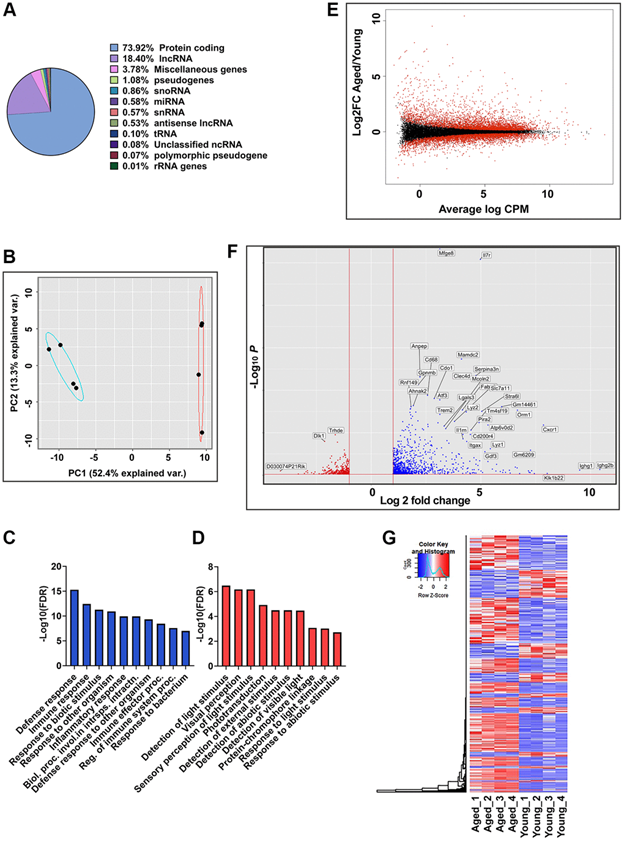
Figure 1.Global gene expression analysis in RPE/choroid of young and aged mice.(A) Pie chart represents the percent of globally expressed transcript subspecies across young (2–3 months,n= 4) and aged (22–24 months,n= 4) mice RPE/choroid from 21,376 annotated transcripts. (B) PCA plots of whole transcriptome data showed distinct clustering of young and aged mice along PC1, which captures the maximum variance (52.4%). Blue and red ellipses indicate young and aged mice and black dots represent the biological replicates (n= 4). (C,D) GO enrichment terms associated with the top 100 PC1 positive loading genes (C) and PC1 negative loading genes (D). (E) MA plot of log2 fold change versus average log counts-per-million (CPM) based on edgeR analysis showing the differential gene expression between aged and young mice RPE/choroid. Red dots indicate differentially expressed genes (FDR ≤0.05), and black dots indicate non-differentially expressed genes. (F) Volcano plot showing genes significantly (p-adj value < 0.05) upregulated (red) and downregulated (blue) in aged mice RPE/choroid. The x-axis represents log2-fold change, and the y-axis represents −log10 (p-value). The dotted line shows a cutoff of −log10 (p-value) < 0.05. Annotated dots represent the top significantly regulated genes. (G) Hierarchical clustering and heatmap analysis of gene expression in the RPE/choroid tissues of the young vs. aged mice. Blue to red represents low to high gene expression.
Authors
(CIIDI Members are in BOLD):
Sushil K. Dubey, Rashmi Dubey, Kyungsik Jung, Alvaro G. Hernandez, Mark E. Kleinman